The trouble with science is that you need to do things properly. I’m working on a paper at the moment where we measured some phase diagrams. We’ve known what the results are for ages now, but because we have to do it properly we have to quantify how certain we are. Yes, that’s right. ERRORS!
I’ve come on a long way with statistics, I’ve learned to love them, I defy anyone to truly love errors. However, I took a step closer this month after discovering bootstrapping. It’s a name that has long confused me, I seem to see it everywhere. It comes from the phrase “to pull yourself up by your boot straps”. My old friend says it’s “a self-sustaining process that proceeds without external help”. We’ll see why that’s relevant in a moment.
Doing errors “properly”
Calculating errors properly is often a daunting task. You can spend
thousands on the software, many people make careers out of it. This will
often involve creating a statistical model and all sorts of clever
stuff. I really don’t have much of a clue about this and, to be honest,
I just want a reasonable error bar that doesn’t undersell, or oversell,
my data. Also, in my case, I have to do quite a bit of arithmetic
gymnastics to convert my raw data into a final number so knowing where
to start with models is beyond me.
Bootstrapping
I think this is best introduced with an example. Suppose we have
measured the heights of ten women and we want to make an estimate of the
average height of the population. For the sake of argument our numbers
are:
| 135.8 | 145.0 | 160.2 | 160.9 | 145.6 |
| 156.3 | 170.5 | 192.7 | 174.3 | 138.2 |
in cm
The mean is 157.95cm, the standard deviation is 16.88cm. Suppose we don’t have anything except these numbers. We don’t necessarily want to assume a particular model (Normal distribution in this case), we just want to do the best with what we have.
The key step with bootstrapping is to make a new “fake” data set by randomly selecting from the original (allowing duplicates). If the measurements are all independent and randomly distributed etc, then the fake data set can be thought of as an alternate version of the data. It is a data set that you could have taken the first time if you’d happened to get a different sample of people. Each fake set is thought equally likely. So let’s make a fake set:
| 156.3 | 192.7 | 160.9 | 135.8 | 135.8 |
| 156.3 | 156.3 | 170.5 | 156.3 | 192.7 |
Mean=161.36cm, standard deviation = 18.5935
As you can see, there’s quite a bit of replication of data. For larger sets it doesn’t look quite so weird. On average you keep about 60% of the original data and the rest is replicated. Now let’s do this again lots and lots of times (say 10000) using different fake data sets each time, generating different means and standard deviations. We can make a histogram
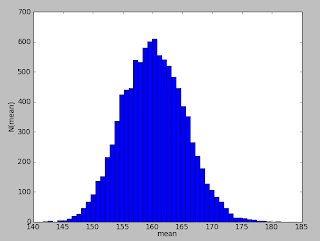
From this distribution we can estimate the error on the mean to whatever confidence interval we like. If it’s 67% (+/- sigma) then we can say that the error on the mean is +/-5.2cm. Incidentally that’s nearly what we’d get if we’d assumed a normal distribution and done 16.88/sqrt(10). Strangely the mean of the means is not 157.95 as the input data was, but 160.2. This is interesting because I drew the example data from a normal distribution centred at 160cm.
We can also plot the bootstrapped standard deviation.
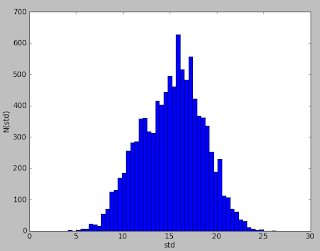
What’s interesting about this is that the average is std=15.2 whereas the actual standard deviation that I used for the data was 19.5. I guess this is an artefact of the tiny data set. That said 19.5 looks within “error”.
So, without making any assumptions about the model we’ve got a way of getting an uncertainty in measurements where all we have is the raw data. This is where the term bootstrap comes in; the error calculation was a completely internal process. If it all seems a bit too good to be true then you’re not alone. It took statisticians a while to accept bootstrapping and I’m sure it’s not always appropriate. For me it’s all I’ve got and it’s relatively easy.
To make these figures I used a python code that you can get here. Data here.
Update: It’s been pointed out to me that working out the error on the standard deviation is a bit dodgy. I think that the distribution is interesting - “what standard deviations could I have measured in a sample of 10?” - but perhaps one should be a little careful extrapolating to the population values. Like I said, I’m not a statistician!